

It makes no difference where you live. You can live in downtown Manhattan, rural Tennessee, Seattle, Bellevue, or Monroe – it doesn’t matter.
Poverty is measured the same wherever you live and regardless of how much it costs you to live.
This is what the poverty map should look like:
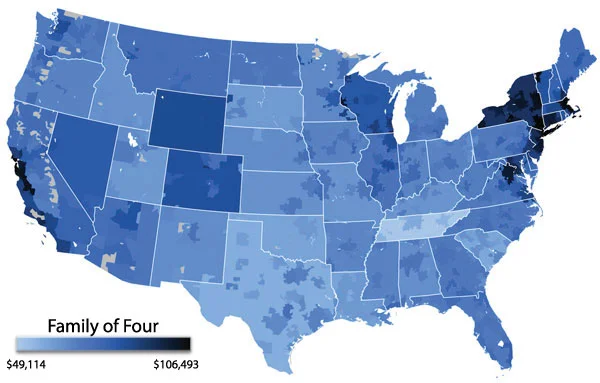
The estimated cost of living for a family of four ranges from a low of $49,114 per year in rural Tennessee to a high of $106,493 in Washington, DC.
It costs a family of four $72,274 per year to live in the Seattle/Bellevue metro area, or $6,023 per month.
You can use the Economic Policy Institute's Family Budget Calculator → to see what it costs to live by family size and location.
The Federal Poverty Line falls far short of reality...
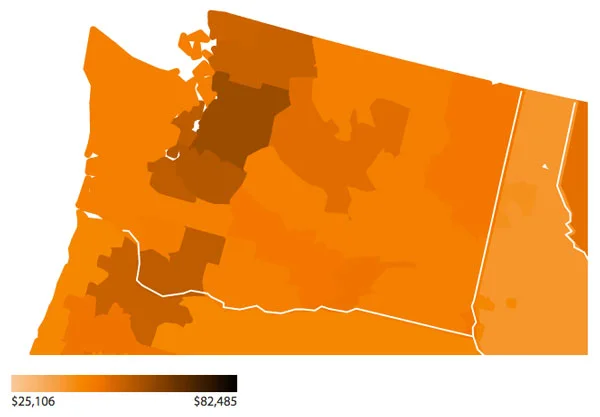
The Federal Poverty Line for a family of four living in rural Tennessee is more than $25,000 lower than the actual cost of living for that family. In Washington, DC, that same family of four, will need $82,000 more than the Poverty Line to live and thrive.
The cost of living for a family of four in Seattle is $48,000 more than the federal poverty threshold.
When Mollie Orshansky created the Poverty Line in 1962, families typically spent about one-third of their household budget on food. The original Poverty Line was based upon three times the cost of an emergency, survival level basket of food. Today we spend only one-seventh.
If we adjusted the Poverty line formula, based upon Mollie’s multiple of food cost, the Poverty Line for a family of four would be over $52,000 – not the $24,250 it is today.
Congress has not changed Mollie's formula in more than 50 years, only adjusting the cost of that original emergency basket of food for inflation.
Interestingly, “we” have chosen to exclude a number of individuals from our measure of poverty. You are not counted if you are incarcerated or serving in the military. You don’t count if you’re institutionalized, as in a care or other facility…and a few more. We miss a lot of people.
There are alternative measures of poverty…
Median Household Income
Mollie felt her initial formula was reasonable – you lived in poverty if your income fell below 50% of the median (half) the families above, half below) household income across the United States.
In 2014, median household income was $53,657.
If we applied the 50% of median household income test, our poverty rate would more than double1
Living -
not surviving
The Organization for Economic Cooperation and Development is made up of 34 member countries including many of the world’s most advanced countries and a few emerging countries like Mexico, Chile and Turkey
The OECD defines poverty this way:
In order to participate fully in the social life of a community, individuals may need a level of resources that is not too inferior to the norms of a community. For example, the clothing budget that allows a child not to feel ashamed of his school attire is much more related to national living standards than to strict requirements for physical survival.
OECD Rates of Poverty

By that measure, of the 34 OECD wealthy, developed countries, only Israel, Mexico, Turkey, and Chile have higher rates of poverty than the United States.
1
Clearly, something is wrong with the way we define and deal with poverty in the United States.
DOWNLOAD AND PRINT THIS ARTICLE AS A "ONE PAGE ON POVERTY" →